
Arriving at an unfamiliar harbour at the wrong stage of the tide turns a straightforward approach into an hour of creeping forward while someone watches the depth sounder and everyone else watches the rocks. Tide tables exist to prevent exactly that. They are short, dense, and surprisingly easy to misread, but once you understand what the numbers represent they become one of the most useful documents on board.
Most harbours on exposed coasts see two high waters and two low waters in roughly 24 hours and 50 minutes, which is why the times drift later by about an hour each day. A tide table gives you the predicted time and height of each of those extremes for a specific reference point.
The critical thing to grasp is what the height is measured from. Tide heights are given above chart datum — a low-water reference level chosen so that the tide rarely drops below it. That number is not the depth of water at the harbour entrance. It is the height you add to the charted depth to find the depth of water.
So if the chart shows 4 metres and the table predicts a height of 2 metres, you are looking at roughly 6 metres of water. Confusing the two is the single most common mistake made with tide tables, and it usually shows up at the worst possible moment.
Before you trust a single figure, check three things in the table's header:
Only high and low waters are listed. Everything between them is your job to work out, and the water does not rise or fall at a steady rate. Near high and low water it barely moves; in the middle of the cycle it moves fastest. If you are crossing a shallow bar two hours before high water, assuming a straight line between the two extremes will flatter you.
Tidal range is simply the difference between high and low water on a given day. It is not constant. Around the new and full moon, the sun and moon pull roughly in line and you get spring tides — the biggest ranges. Around the quarter moons, the pulls partly oppose each other and you get neap tides, with the smallest.
In some harbours the difference is modest. In others, the neap range may be a quarter of the spring range. That changes everything about an arrival: a harbour with a shallow sill may be reachable for several hours either side of high water on a spring tide, and only for a tight twenty minutes on a neap. Read the numbers for the day you are actually arriving, not an average you remember from last summer.
Not every harbour gets its own full predictions. Instead, corrections are published against a nearby standard port. You take the standard port's high and low water times and heights, then adjust them for the secondary location.
Corrections usually come in two forms: a time difference, such as high water +0025, and a height adjustment, either a fixed difference in metres or a factor to multiply by. Some corrections apply to high water only, some to both, and a few vary with the size of the tide.
The order of work is straightforward:
One habit worth keeping: never apply a height factor to a time, or a time correction to a height. They look similar in a cramped table and they are not interchangeable. As a rough example, if the standard port predicts high water at 05:30 with a height of 4.2 metres, and the secondary port shows high water +0025 with a height factor of 0.85, you would expect high water there around 05:55 at about 3.6 metres.
The arithmetic for a safe arrival is short. Take the charted depth at your shallowest point of the approach, add the predicted height of tide for the time you expect to be there, and subtract your draft. What remains is your under-keel clearance.
Suppose the entrance has a charted depth of 2.8 metres and the tide will be 1.9 metres above datum when you cross. That gives 4.7 metres of water. With a draft of 2.2 metres you have 2.5 metres beneath you — comfortable in settled weather. Run the same entrance at neaps, with a height of only 0.5 metres, and you have 1.1 metres of water over a 1.5 metre draft. That is not an arrival, that is a grounding.
Remember also that charted figures with a line beneath them, such as a drying height of 1.2 metres, mean the feature dries at low water. The depth there is the tide height minus the drying height.
For the hours between high and low water, the rule of twelfths gives a decent estimate for a roughly six-hour fall or rise:
Predictions are astronomical only. Wind and pressure can raise or lower the actual water level by a significant margin, and they do not appear in the table. A strong onshore blow combined with low pressure can push water into an estuary; sustained offshore wind can hold it out. Heavy rain in a river harbour, or a long ocean swell breaking across a bar, changes the picture again.
Sensible margins, then:
A tide table is a prediction, not a promise. The sounder and your own eyes are the truth.
Before you commit to an entrance, sit down with the table and do this in order. Confirm the time zone and units. Identify the standard port and work through any secondary port corrections. Write down the time of the next high water and its predicted height. Calculate the depth of water at the entrance for your planned arrival time, subtract your draft, and decide whether the margin is acceptable. If it is not, either slow down and wait for more water, take a turn offshore, or anchor in deeper water rather than pressing on.
Then check the weather and the sea state, note your fallback options, and make sure everyone on board knows the plan. Tide tables reward a few minutes of quiet arithmetic with a calm, boring arrival — which is exactly what you want.
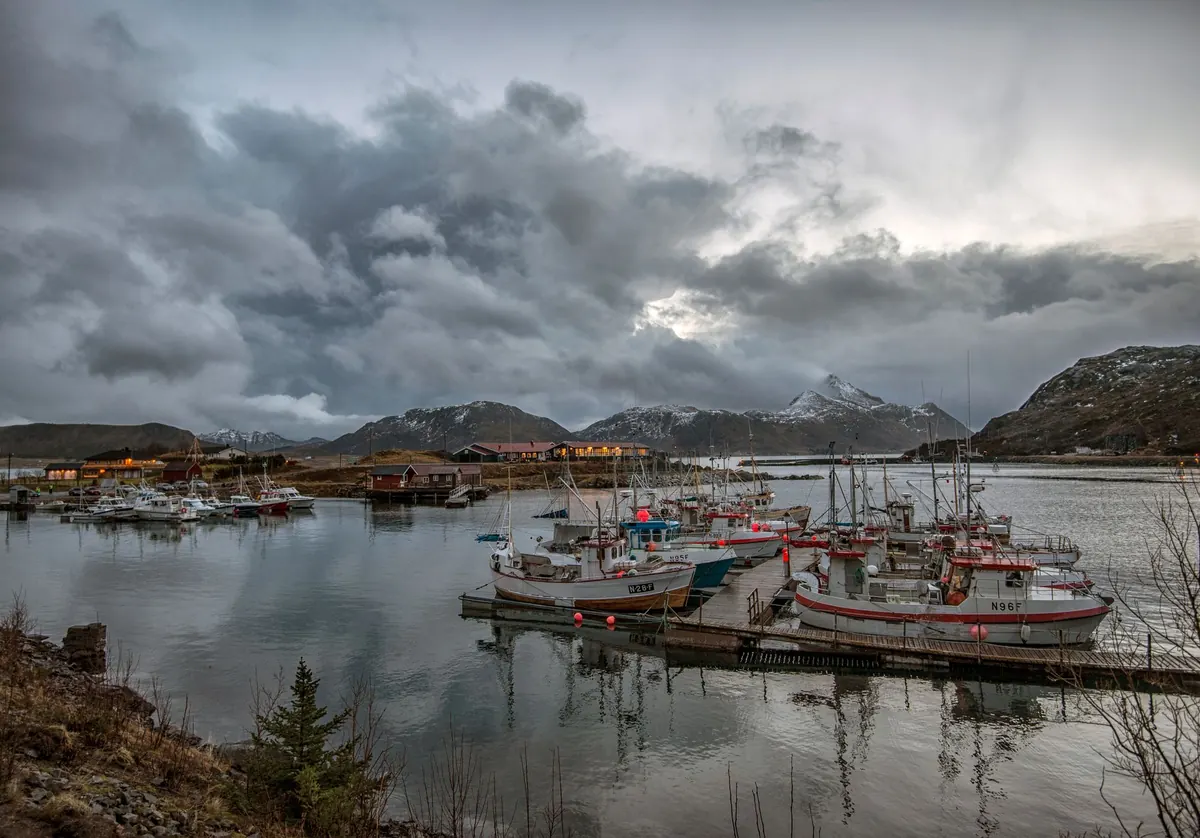
Photo: AS_Photography / Pixabay

A practical checklist for cross-border coastal cruising: the documents to carry, the safety gear officials ask...
Winter liveaboard life in Atlantic harbours rewards planning: read the marina contract, judge how the berth faces...
A practical guide to picking up a mooring buoy under power or sail, with approach plans, line handling, and safety...

Navigate the world's harbours with confidence..
